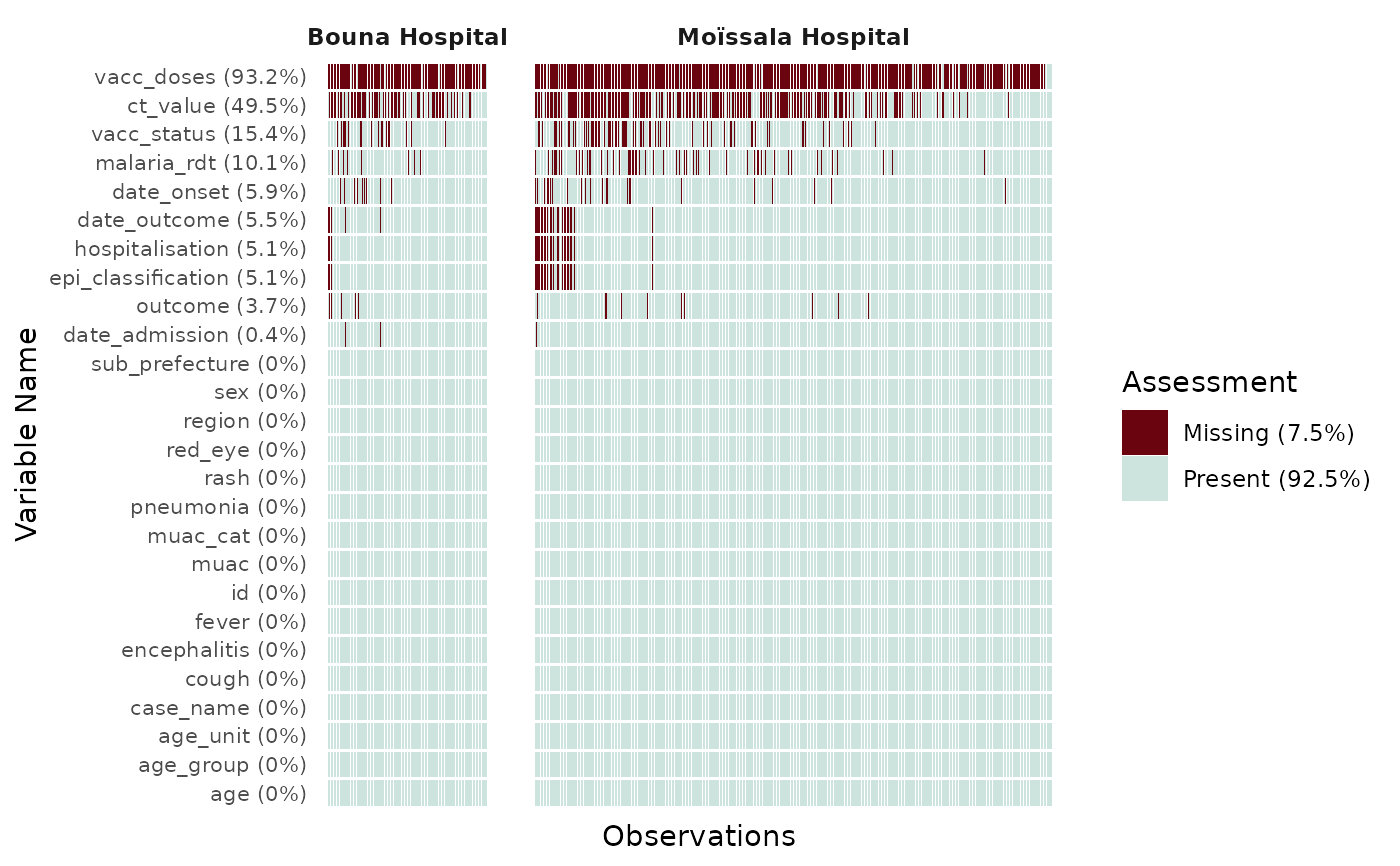
Function to generate a tile plot exploring the missing values for all observations across all variables of a dataframe.
Usage
plot_miss_vis(
  x,
  facet = NULL,
  col_vec = c("#6a040f", "#cce3de"),
  y_axis_text_size = 8
)Examples
# Use simulated measles data

suppressMessages(library(dplyr))

epivis::moissala_measles |>
  filter(site %in% c("Moïssala Hospital", "Bouna Hospital")) |>
  plot_miss_vis(facet = "site")