Stacked barplot
Usage
plot_stacked_bar(
  df,
  cols,
  levels_value,
  keep_na = TRUE,
  use_counts = TRUE,
  flip = FALSE,
  x_lab = waiver(),
  caption = TRUE
)
Arguments
- df
un-aggregated dataframe (linelist).
- cols
vector of character/factor variables names in
dfto be displayed in the barplot.- levels_value
vector of level values to be used for the plotting.
- keep_na
logical, default =
TRUE.Keep NAs in the graphs and the proportions ?- use_counts
logical, default =
TRUE.Use counts or proportion in y axis ?- flip
logical, default =
FALSE. Flip the barplot ?- x_lab
character name for the x axis
- caption
logical, default =
TRUE.Display the plot caption summarising the number of cases ?
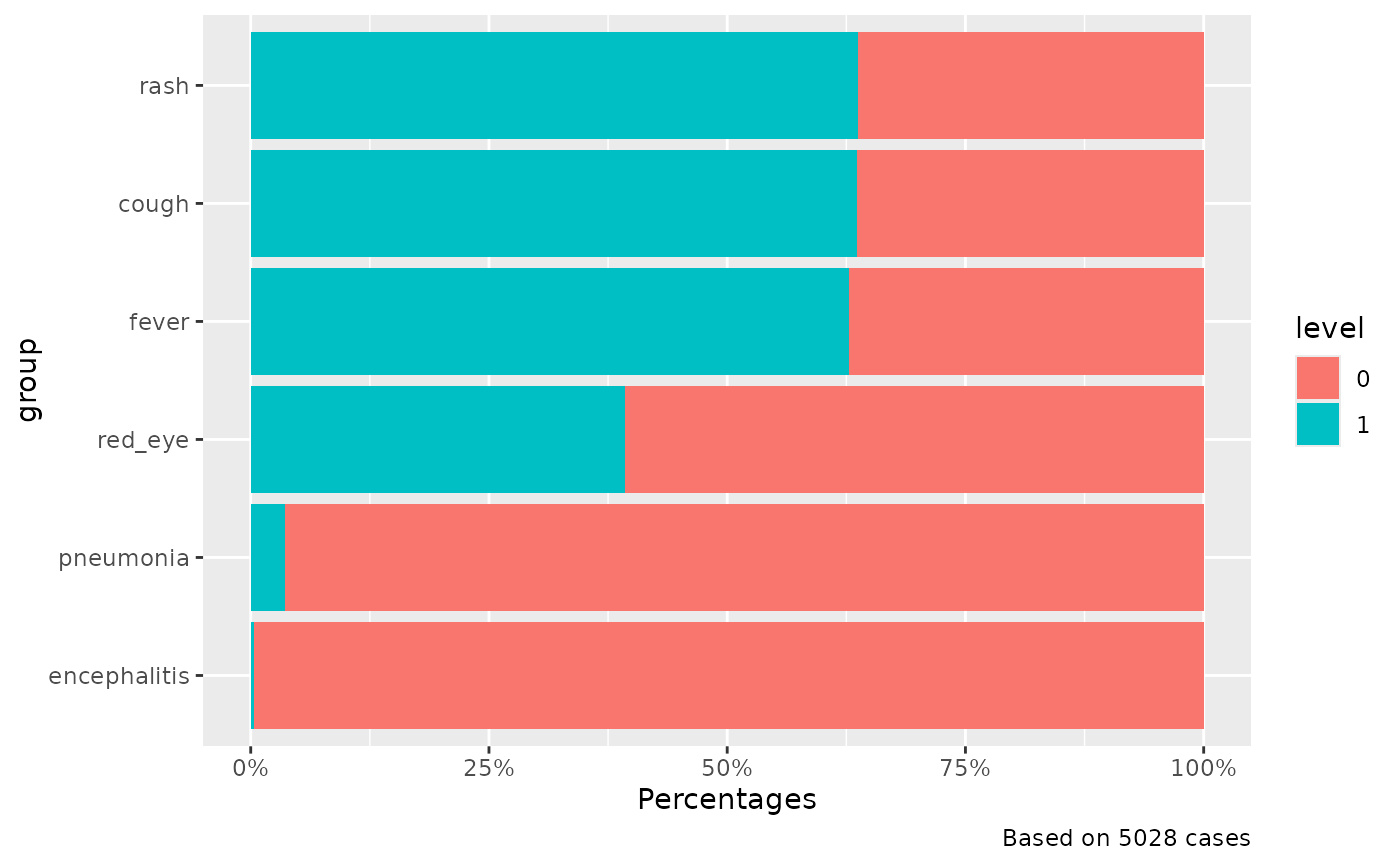
Examples
# Use fake data from Epidemiologist R handbook

suppressMessages(library(dplyr))

epivis::moissala_measles |>
  mutate(across(
    c(
      fever,
      rash,
      cough,
      red_eye,
      pneumonia,
      encephalitis
    ),
    ~ as.character(.x)
  )) |>
  plot_stacked_bar(
    cols = c("fever", "rash", "cough", "red_eye", "pneumonia", "encephalitis"),
    levels_value = c(0, 1),
    keep_na = FALSE,
    use_counts = FALSE,
    flip = TRUE
  )