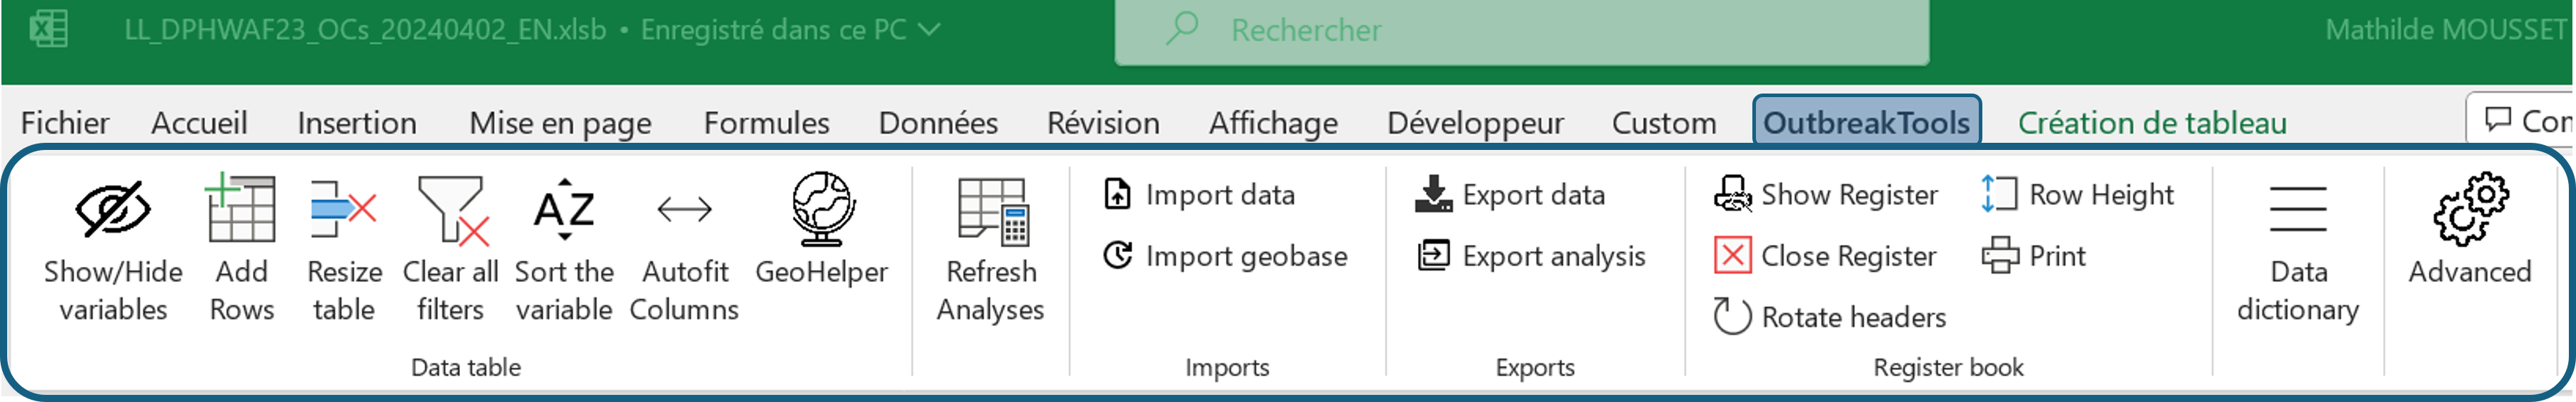
Linelist ribbon
Recent version of Excel have a top ribbon/menu that display most buttons and functionalities in several tabs. Outbreaktools files (setup, designer and linelists) each have an extra tab in this menu containing OutbreakTools functionalities.
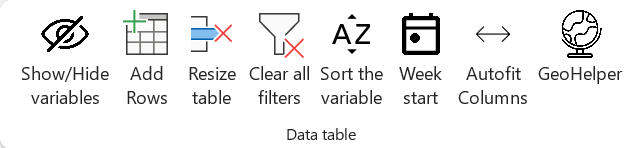
Data table
Show / Hide variables
Clicking on the “Show/hide variables” button opens a window listing all the variables in this linelist sheet.
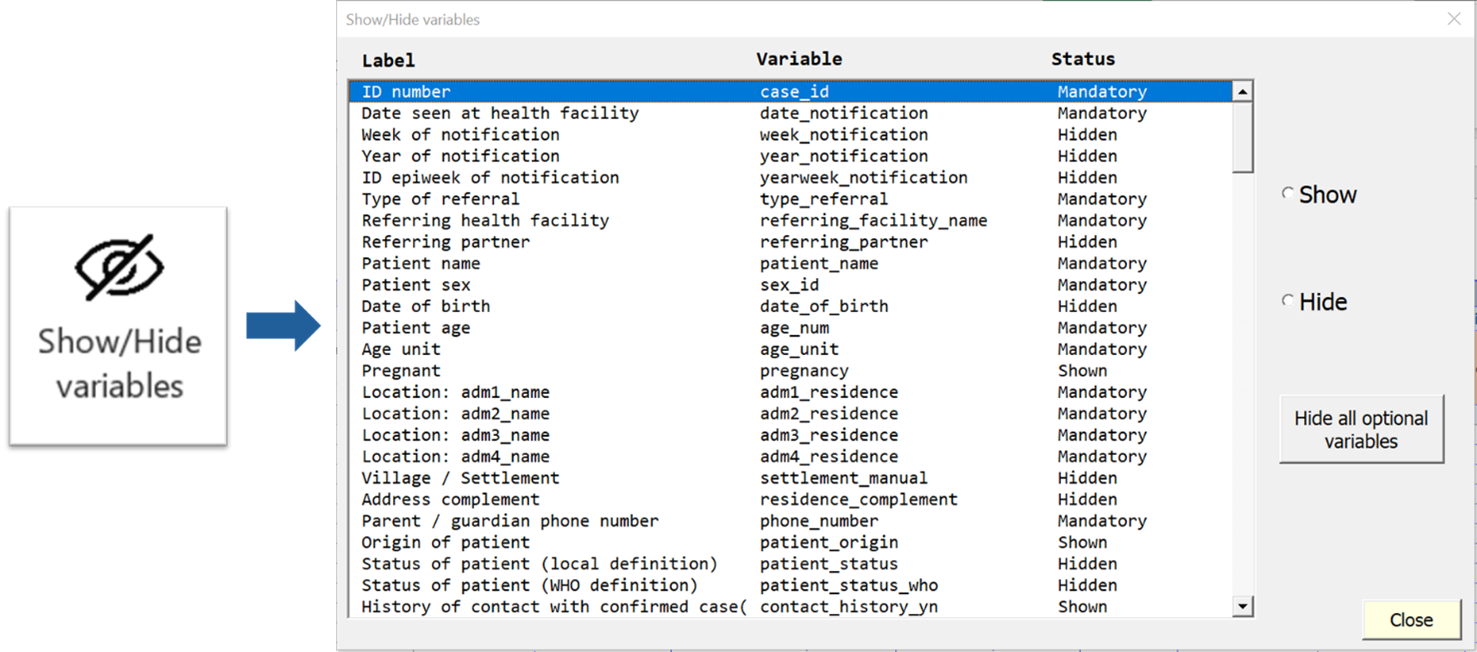
Variable can have three visibility status:
Mandatory: variables cannot be hidden with the Show/Hide
Shown: variables are currently visible but can be hidden by ticking “Hide” on the right
Hide: variables are currently hidden but can be made visible by ticking “Show” on the right
You can hide all optional variables in one go by clicking on the “Hide all optional variables” button.
This is useful if you want to create a minimal linelist because the provided linelist has a lot of variables shown by default.
After use, the button will change to “Show all optional variables”, to allow the reverse action.
Add rows
By default, the linelist has 200 empty lines. Click on the “Add Rows” button to add 200 new empty rows.
In addition, five new rows automatically appear when you start entering data in the last row.
Resize table
Click on the “Resize table” button to remove any empty rows at the end or in the middle of the linelist.
Clear all filters
To remove all the filters at once, click on the “Clear all filters” button. This is useful if you applied several filters across the table and want to reverse to the full view without missing one.
Sort a variable
If you need to visualise your data by sorting on a specific variable, you need to use the sorting function. Place the cursor in a cell of the column you want to sort (from line 9) and click on the button.
The first time you click, you have a message to confirm the action, once you click yes, you cannot undo it. The first click sorts by ascending order, the second by descending order.
Week start
The “Week start” button controls the day that starts the week in the linelist. The selected value will be applied to the whole linelist (calculated epiweeks, as well as in the analyses).
When you click on the button, a pop up window appears, where you can select the day of the week corresponding to your country.
Autofit columns
Use this button to improve column width so that the columns take less space. The fit takes into account the label, the length of categories of the variable (if any) and the name of the variable (hidden).
Additionaly, you can manually modify the width of columns in the linelist to adjust to content the way you would do in any Excel file. The width of the column is also migrated during migration.
GeoHelper
The GeoHelper is a popup window that helps you entering geographic data such as the origin of the patient or the name of the facility (if the “hf” control was used for the variable). It is mostly used to enter data on the patient data sheet, but it is also useful on the Spatio-Temporal analysis sheet.
To use it, place your cursor in a “geo” or “hf” column (you can recognise them thanks to the orange headers), in the admin 1 level. Click on the “GeoHelper” button, or hit the shortcut Ctrl + Shift + G. It opens a window, with several tabs, depending on whether you are in a “geo” (described by four visible columns) or in “hf” (described by one visible column).
If you are in a “geo” section, you will have three tabs that you can use to select administrative levels.
- Cascade: select the admin levels with cascading menus, by selecting one admin level after the other, starting from the highest one.
- Search: search by typing the name (needs at least 3 letters)
- History: quickly find a previous entry entered through the GeoHelper (does not work for data entered using the regular cascading dropdowns).
Once the location has been found, select it and click on “OK”.
Refresh analyses {sec-refresh}
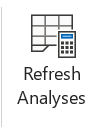
Hit the “Refresh analyses” button to update analyses on all analyses sheets in one go. You should use it whenever you entered new data or when you applied filters to existing data and want to see the analyses on this subset of data.1
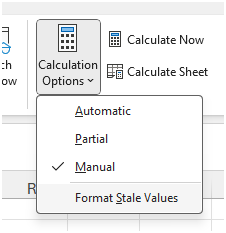
If the numbers in the analyses are striken, it is because of a new Excel functionality. The documentation is limited and we have not been able to modify the refresh button to take it into account yet. You have two options: use the F9 shortcut before hitting “Refresh analyses”, or un-tick the “Format Stale Values” option in the Calculation options of the Formula tab of Excel options.
Imports
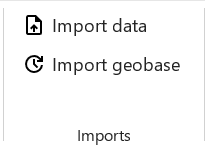
Import data
The “Import Data” button allows you to import data in the linelist. This data must be in a special format typically produced by exporting data from another OutbreakTools linelist for the same disease2.
Select the file to import using the navigating windows and click “Ok” to launch the import. At the end, a message informs you of the success and provide a little import report. Inspect it to see if there are any unexpected discrepancies (loosing variables unexpectedly is a red flag!).
If there is already data in the file, a message will inform you of that fact and ask you what you wish to do. It is possible to append the new data at the bottom of the already present data. This is a handy way to create temporary master linelist, or to gather data entered by two data-encoders.
Make sure the data is not overlapping before importing, as the import just pastes the new data at the bottom of the existing data, and you would end up with duplicates to clean manually.
Import geobase
The “Import geobase” button allows you to import a geobase in the linelist. If the current linelist already has a geobase, it is replaced.
The import of the geobase does not affect the data already entered in the linelist, it only fills the modalities offered by dropdown menus. If data is already present in the linelist and the new geobase has different levels, you need to correct them yourselves.
Exports
OutbreakTools linelists have the feature to export data in a separate Excel file, to share with partners or perform more advance analyses. The characteristics of the exports (which variables, anonymised or not, password protected or not etc.) are pre-defined in the setup file that is used to generate the linelist.
The regular exports buttons are available in the “Export section” of the ribbon, and the “Export for migration” is available in the Advanced section of the ribbon.
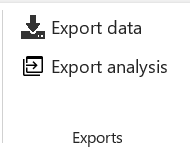
Export data
All OBT linelists created by Epicentre should have at minima an “Anonymous export for MSF” button. In addition to that, other exports may be available in specific linelist files.
Click on the “Export Data” button to open a popup window, with several options. At the top there are buttons for different exports. After clicking on the desired one, a window pops-up for saving the export. If “Export Filtered Data” is selected, a confirmation message will pop-up first to ask you whether this is what you really want.
Once the folder has been selected (avoid root folder like PC, C:, D:) and after clicking “OK”, a new window opens to confirm the export and, if the export is protected, provide the associated password.
If you forgot the password, click on the “Export Button” again, and then click on the “Show actual private key” to display the password again.
Click on the button “Generate new password” to change the password used by default.
Export analyses
You can export all the tables from the analysis sheets in one document by using the “Export the analysis sheets” button and selecting the directory where you want to save them.
If the analysis are made on filtered data, the tables will be exported as such.
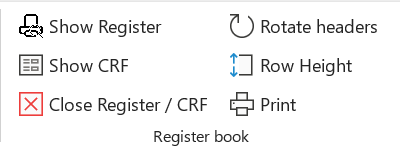
Register and Case report form
You can print a register directly based on the linelist.
The features from this category only work if you are on a data entry sheet, otherwise you get an error message.
Click on “Show register” to open a new sheet that contains all the variables from the linelist. On this sheet, you can use the Data Table features just as in the original linelist sheet:
“Add rows” and “Resize table” work exactly the same (except that it adds 10 rows at once)
“Show/Hide variables” works the same but looks a bit different. Instead of “Show” you can select “Print” and the orientation of the header. You can also import the parametrisation of hidden/shown columns from the regular linelist table, or change column width.
You can rotate all the labels at once by clicking the “Rotate headers” button. You can define the heigh of the row by clicking directly on “Row height”, a pop-up opens where you can define the heigh.
All labels are editable.
You can hide all calculated variables which are not needed in a paper register.
Once customized, you can close the sheet by clicking the red cross (it actually hides the sheet, but it still exists, so all your modifications are saved until the moment you reopen the sheet to print it again).
Once ready, you can use the “Print” button to open the print preview view (whether you are on the register sheet or the linelist sheet). If you are satisfied, you can print.
Advanced
There is an “Advanced” button on the right of the ribbon, that opens a popup window with options that are used less often.
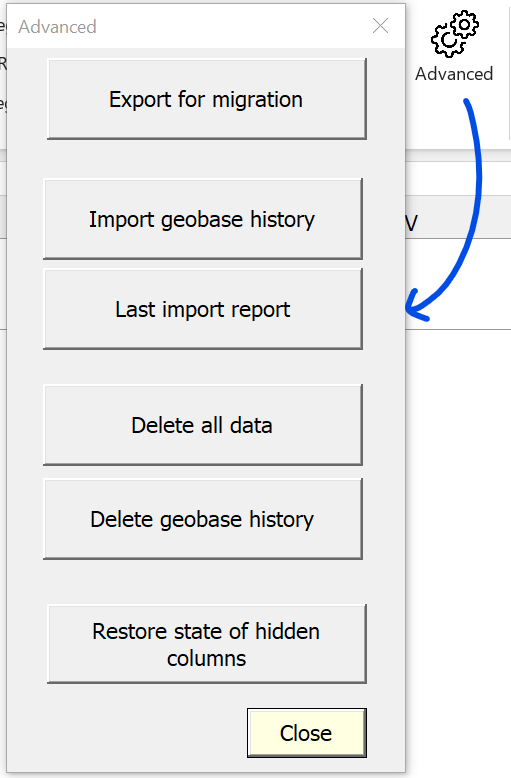
Export for migration
This button exports raw data and metadata for migration to another linelist file.5
You can choose to export the patient data and/or the geobase and/or the history of the geobase (history list in the GeoHelper). There are also options to include metadata on the state of hidden/shown columns (to not have to redo the configuration in the new file), and the updated labels of the custom variables, if you used these variables.
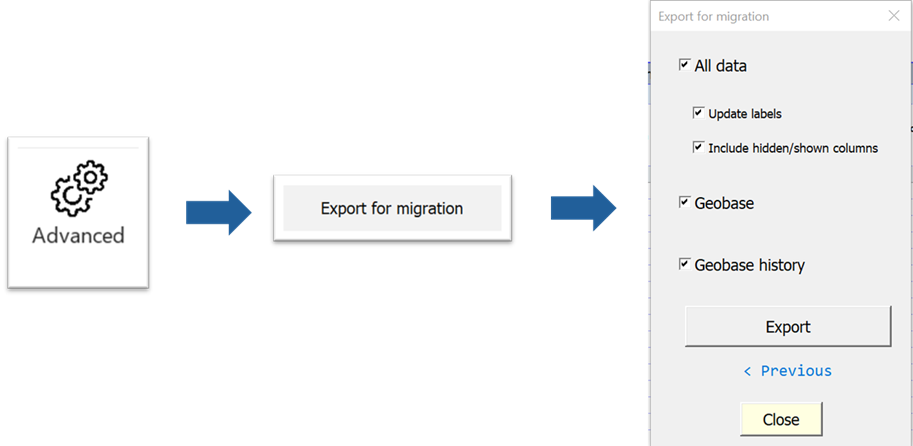
Select the options and click on “Export”; a window pops-up asking where to save the exported file. Select the folder and click on “OK”.
- a file containing the data and metadata
- a file containing the geobase that is currently in the linelist, as well as the history from the GeoHelper
- a file containing *only the GeoHelper **history*6
Import geobase history
This button allows you to import a file containing the history of the geobase (such a file was created by exporting the data from migration, see above).
Last Import Report
The button allows you to display the report from the last import made.
Delete data or geobase history
This are dangerous buttons that allow you to delete data or geobase history from the linelist.
“Delete all data” removes all the data you entered from the workbook. After clicking on it, you will have a warning message. To confirm the deletion, you will need to enter the full name of the file.
“Delete geobase history” allows you to empty the table with the geobase history so the list of suggestion of the history method from the GeoHelper will be empty.
Footnotes
Do not forget to remove the filters and refresh the analyses at the end to not be confused by the numbers in a couple of days↩︎
But a good R script can mimic the format too↩︎
This data may or may not be anonymised, contain all columns or have extensive metadata depending on how the exports are encoded↩︎
This export contains all the columns, and as much metadata as possible↩︎
Whether that is to upgrade versions, move out of a corrupt file or create a temporary master-linelist.↩︎
This option is useful if you want to upgrade to a new version of the geobase but wish to keep your GeoHelper history. You do not have to use it for general purpose migration.↩︎